Sales_Management
SALES OVERVIEW
Project overview
- This projec explores different business metrics and how they can be displayed graphically to follow them
- I explore the relation between sales, budget, costumers and products
- We can obtain conclusions that will help us to make better marketing campaigns and improve profits
- The tools used are SQL server and Power BI
Objectives:
The goal is to build a sales report that shows summarized information about the business´s current situation to understand how to make more profits.
The most important indicators are sales, budget, top customers, and top products:
Deliverables:
| Demanding | Value | Deliverable |
|---|---|---|
| A dashboard that summarizes the internet sales current situation | To understand which products and customers have the biggest impact on the company | A dashboard that shows the most important metrics and that can be updated everyday |
| An overview of sales organized by clients | To acknowledge which customers, buy more and how to sell more to them | A dashboard that can filter customers by product, city, and relevance |
| A detailed overview of the best products | To follow those products that have better sales | A dashboard that can filter products by customer, city, and relevance |
Data transformation and data preparation
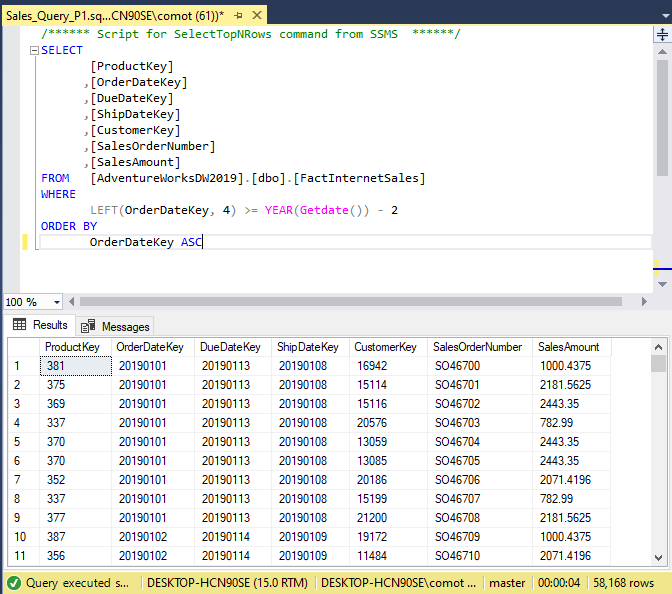
The data was taken from the Microsoft sample data and was extracted using SQL server into csv files to use them in the Power BI dashboard.
Date_table was used to retrieve dates about the performances of the sales through time
Sales_table, product_table and customer_table show information about sales, products and customers in that order
You can see all the SQL queries HERE:
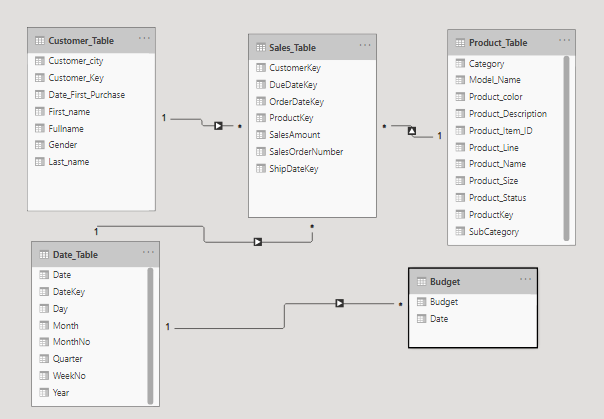
Data model:
You can see in this image the data model used in Power BI after the data was extracted
Visualizations
The final product is a 3 pages dashboard. The first one tell us a general perspective about the sales performance while other two focus in customers and products
You can see the final dashboard clicking HERE or in the image below
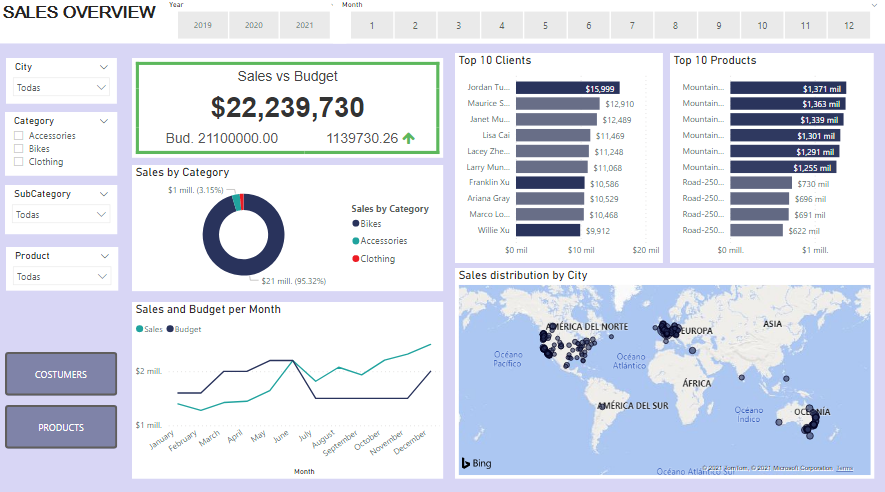
Conclusions
- The best customers are Jordan Turner, Maurice Shan, Janet Munoz, and Lisa Cai
- The best product is the Mountain-200 Black but all color sell well
- During July, September, and November 2020 our sales were less than Budget. I need more information to understand why